
Operational Workforce Planning Metrics That Actually Matter
Track the right operational workforce planning metrics — capacity, cost, quality, agility — and turn them into decisions rather than dashboard noise.
Ployo Team
Ployo Editorial
TL;DR
- Operational workforce planning aligns staff numbers and skills with day-to-day demand.
- 31+ workforce metrics exist (HiBob) — focus on the 15–20 that drive decisions.
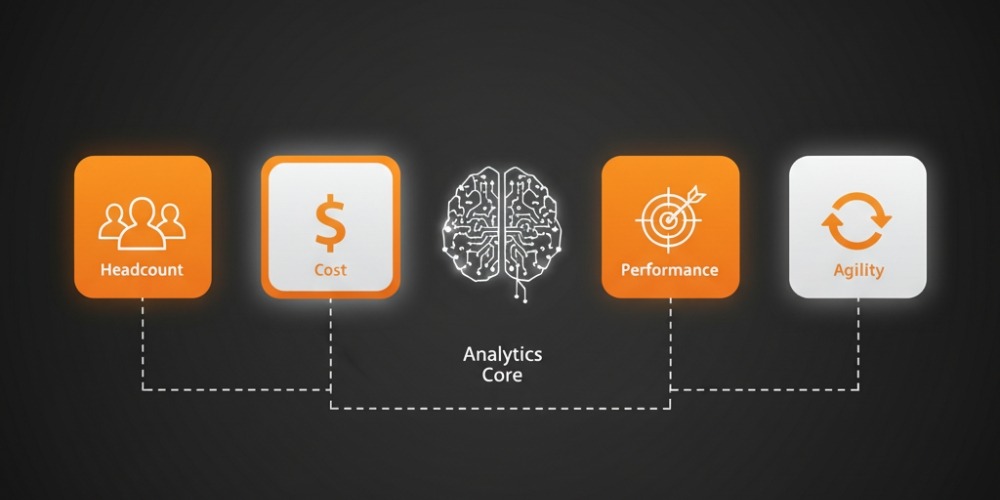
- Four key categories: capacity, cost, quality, agility.
- Pitfalls: tracking too many metrics, bad data, missing business alignment.
- AI and automation turn data into proactive decisions instead of retrospective reports.
Workforce planning without metrics is guesswork. Without clean data, scheduling slips, costs creep, and team morale erodes. With the right metrics — measured deliberately and tied to specific decisions — operational workforce planning becomes a system rather than reactive firefighting. This guide covers what to track, why, and how to turn numbers into action.
What Operational Workforce Planning Is

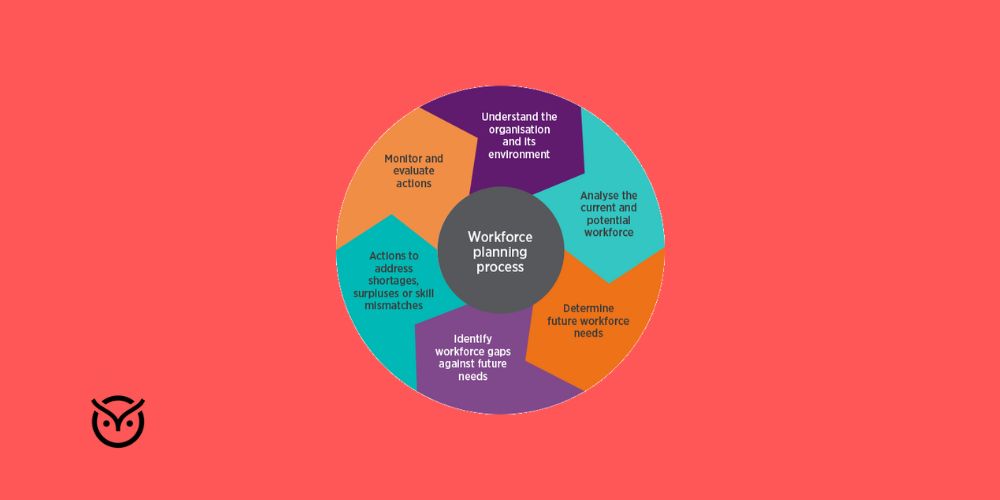
The practice of ensuring the right number of people with the right skills are in the right places at the right time — focused on day-to-day operations rather than long-horizon strategy.
Per the CIPD workforce planning factsheet, the process involves analysing current supply, forecasting demand, identifying gaps, and matching staff to tasks. Operational planning narrows this to shifts, peak times, project staffing, and immediate skill gaps.
Why Metrics Matter

Three concrete benefits of disciplined measurement.
Reality vs assumption
What you think your staffing looks like and what the data shows are usually different. Metrics close the gap.
Pattern visibility
HiBob's analysis covers 31+ workforce metrics. The right ones surface patterns — over-staffing here, skill shortages there, retention risks elsewhere — that gut feel misses.
Investment justification
Numbers make the case for new tooling, training programs, and process changes. Without them, decisions stall.
Pair operational metrics with broader workforce planning and analytics for full-funnel visibility.
Four Core Metric Categories
| Category | What it tracks | Examples |
|---|---|---|
| Capacity & supply | Available people vs need | Headcount, FTE, internal mobility rate |
| Cost | Financial impact of staffing | Cost-per-hire, overtime cost, premium pay |
| Quality & performance | Skill and engagement quality | Time-to-hire, quality-of-hire, retention rate |
| Agility & risk | Adaptability and flexibility | Roles with no backup, shift-reallocation speed |
A coverage ratio (scheduled vs required staff) belongs in the demand/alignment view alongside these four. Together they cover both today's staffing reality and tomorrow's risk.
Turning Metrics Into Action

Numbers in dashboards don't change outcomes. Connecting each metric to a decision does.
Link metrics to triggers
Set thresholds. Example: "If vacancy rate >10% or time-to-fill >45 days, ops planning team intervenes." This shifts metrics from quarterly review into operational decision tooling.
Cross-reference context
Overtime spike isn't always staffing — it could be system downtime or unclear scope. Always validate the narrative behind the number.
Match action to scale
A 5% overtime increase needs different attention than a 25% spike. Tier responses to magnitude.
Common Pitfalls

Four traps that consistently distort planning.
Tracking too many metrics
If you can't explain what action each metric drives, drop it. "Metric soup" produces dashboard noise, not decisions.
Bad data quality
Garbage in, garbage out. Time logs, job codes, shift data must be clean and current. Without that, all downstream planning is suspect.
Misaligned with business goals
Tracking overtime when the company cares about customer response time is a mismatch. Tie every metric to a real organisational outcome.
Correlation vs causation
A drop in productivity might be system downtime, role definition gaps, or absence patterns — not necessarily a staff performance issue. Always look beyond the number.
How Technology Helps

Modern workforce planning tools combine scheduling, payroll, and predictive models into a single data layer. AI forecasts attrition, workload spikes, and training needs weeks in advance.
When workforce forecasting connects with attendance logs, shift plans, and performance data, planning shifts from reactive to anticipatory. The compound effect across a year is significant.
Where Workforce Metrics Are Heading

Three directions worth watching.
Personalised KPIs
Metrics adapted by role, location, and skill profile rather than universal scoring.
Dynamic planning
Algorithms adjusting schedules and staffing automatically based on real-time conditions — pipeline, demand, even weather.
Soft-skill metrics
As work patterns change, "how capable are people of evolving" becomes as important as "how many do we have."
The Bottom Line
Operational workforce planning isn't about more metrics — it's about the right metrics, measured cleanly, tied to specific decisions. Track capacity, cost, quality, and agility. Set thresholds that trigger action. Connect data to business outcomes. Invest in tools that bring the data together. The teams that do this hire better, schedule smarter, and build the kind of operational resilience competitors notice over time.
FAQs
How many metrics should I track?
15–20 core metrics. Enough for substance, few enough that each clearly drives a decision.
Do metrics vary by industry?
Yes. Manufacturing focuses on shift coverage and overtime; tech might emphasise project velocity or contractor ratios. Same principles, different specifics.
What's the biggest workforce metric mistake?
Collecting data without linking it to a decision. Numbers without actions become dashboard decoration.
How does leadership shape metric use?
Leaders set tone — metrics as improvement signals, not punishment tools. Without that framing, teams hide problems rather than surface them.
How do workforce metrics connect to financial performance?
Better planning means fewer vacancies, less overtime, lower turnover. Each translates directly to profitability over the cycle.
Keep reading

Choosing a Workforce Planning Model: Five Approaches Compared

How Workforce Planning + Analytics Improve Recruitment Accuracy
